The oil price is slowly moving away from the August support at $88.00, and now we are already at the $92.65 level. Yesterday, the oil price once again confirmed the support at $88.00 and then quickly jumped to the $92.00 level. During the Asian trading session, the price of oil hovered around the $92.00 level, followed by a bullish impulse that continued a five-day rising trend. The moving averages are now all on the bullish side and provide support for the price of oil to continue towards the next higher levels. Potential higher targets are $94.00, and $95.00 and $96.00 levels. We need a negative consolidation and pullback below the $92.00 support zone for a bearish option. After that, we return again below the moving averages, and based on that, we can expect a further drop in the price of oil. Potential lower targets are $91.00 and $90,00 levels. If the bearish pressure intensifies, the price could drop again to the $88.00 support zone.
Natural gas chart analysis
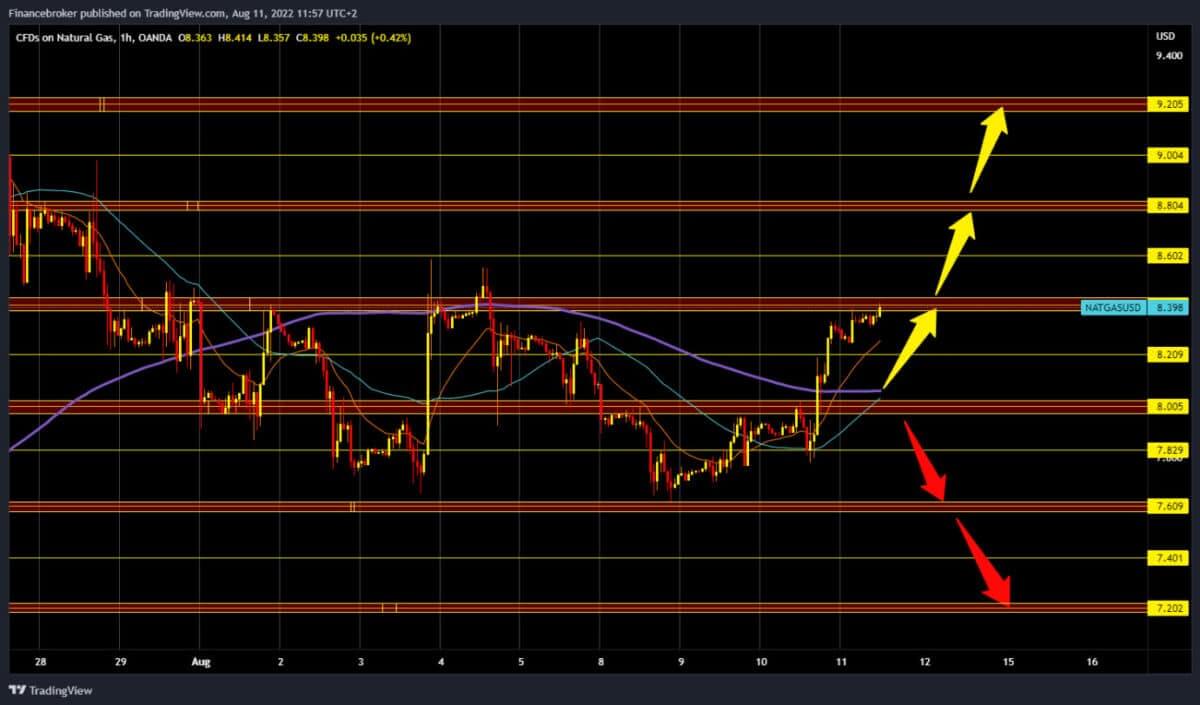
The price of natural gas yesterday broke through the barrier at $8.00 and found itself above again. During the Asian trading session, it continued to rise to the $8.40 level. We are now consolidating at that level, and it is possible that we will see a break above. To continue the bullish option, we should hold above the $8.40 level and then try to continue further towards the $8.60 and $8.80 levels. For a bearish option, we need a negative consolidation. After that, the gas price would head first towards $8.20 and then towards the $8.00 support zone. If the bearish pressure continued to increase, the price would continue to retreat. Potential lower lows are $7.80 and the $7.60 August low.
Market overview
Oil prices quickly moved above the $90.00 resistance as recession fears eased. In its monthly report, the International Energy Agency (IEA) said it expects global oil demand to rise by 2.1 million barrels per day next year, surpassing pre-Covid levels. This move in oil prices could be interpreted as a classic pullback since the Energy Information Administration (EIA) reported a large build-up in oil inventories last week. EIA oil inventories rose by 5.458 million barrels.
BONUS VIDEO: Weekly news summary from the markets
Support
Platform
Spread
Trading Instrument
Get the latest economy news, trading news, and Forex news on Finance Brokerage. Check out our comprehensive trading education and list of best Forex brokers list here. If you are interested in following the latest news on the topic, please follow Finance Brokerage on Google News.
We use cookies to ensure that we give you the best experience on our website. If you continue to use this site we will assume that you are happy with it.Ok