- The jump in oil prices stopped yesterday near the $80.00 level.
- The gas price continued to fall, and today’s minimum is $5.00.
Oil chart analysis
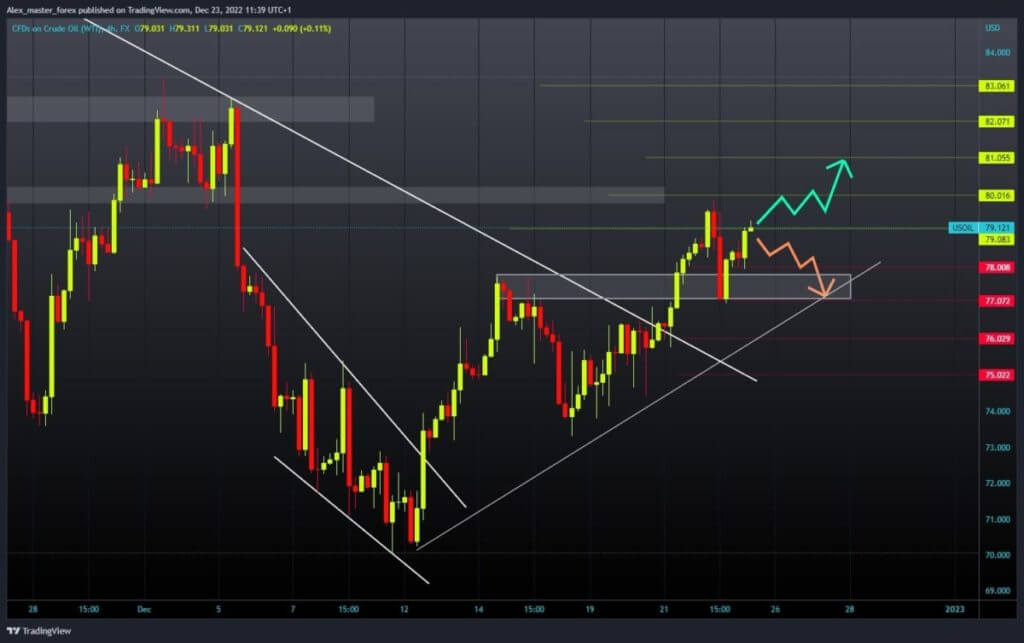
The jump in oil prices stopped yesterday near the $80.00 level. This was followed by a quick bearish impulse that pushed the price down to the $77.00 level. During the Asian trading session, the oil price recovered and is now at $79.00. For a bullish option, we need a positive consolidation and a return to the resistance zone around the $80.00 level.
A price break above and staying higher could trigger a new bullish impulse and continued oil recovery. Potential higher targets are the $81.00 and $82.00 levels. For a bearish option, we need a negative consolidation and pullback below the $78.00 level. This would turn us back to the previous support level of $77.00. A price break below would only extend the downtrend to lower levels. Potential lower targets are the $76.00 and $75.00 levels.
Natural gas chart analysis
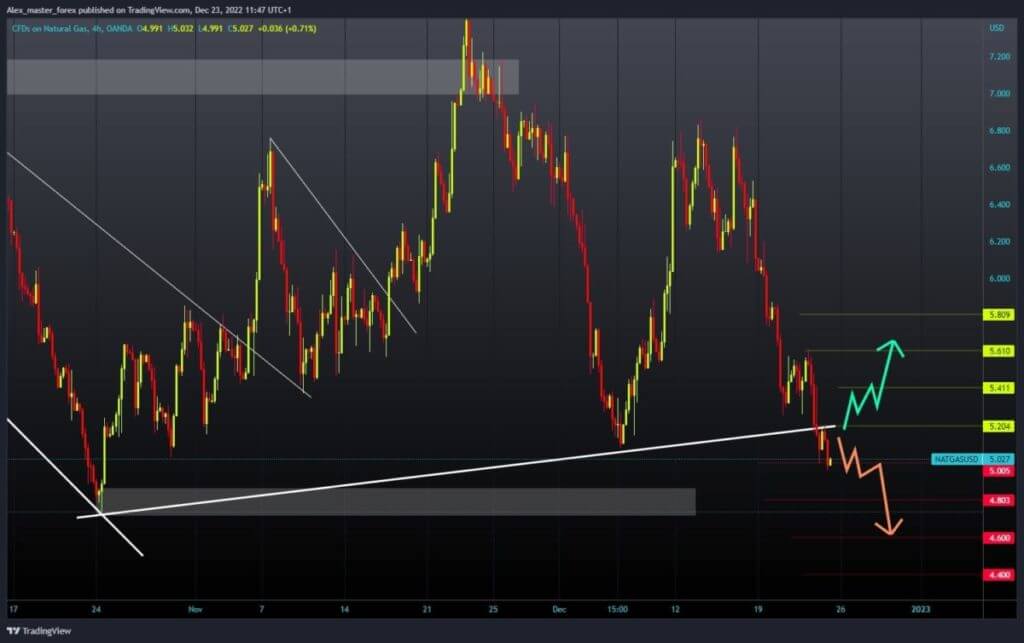
The gas price continued to fall, and today’s minimum is $5.00. Yesterday’s gas price failed to consolidate and initiate a bullish impulse above $5.20. It was followed by a breakout below and a drop to the $5.00 level. For a bullish option, we need a positive consolidation and a return above the $5.20 level. After that, we get additional support as we climb above the trend line.
With the next impulse, we would start a further recovery of gas prices. Potential higher targets are the $5.40 and $5.60 levels. For a bearish option, we need a negative consolidation and a break below the $5.00 level. That would not be good for the price as we could see a further pullback. Potential lower targets are the $4.80 and $4.60 levels.

BONUS VIDEO: Weekly news summary from the markets

