

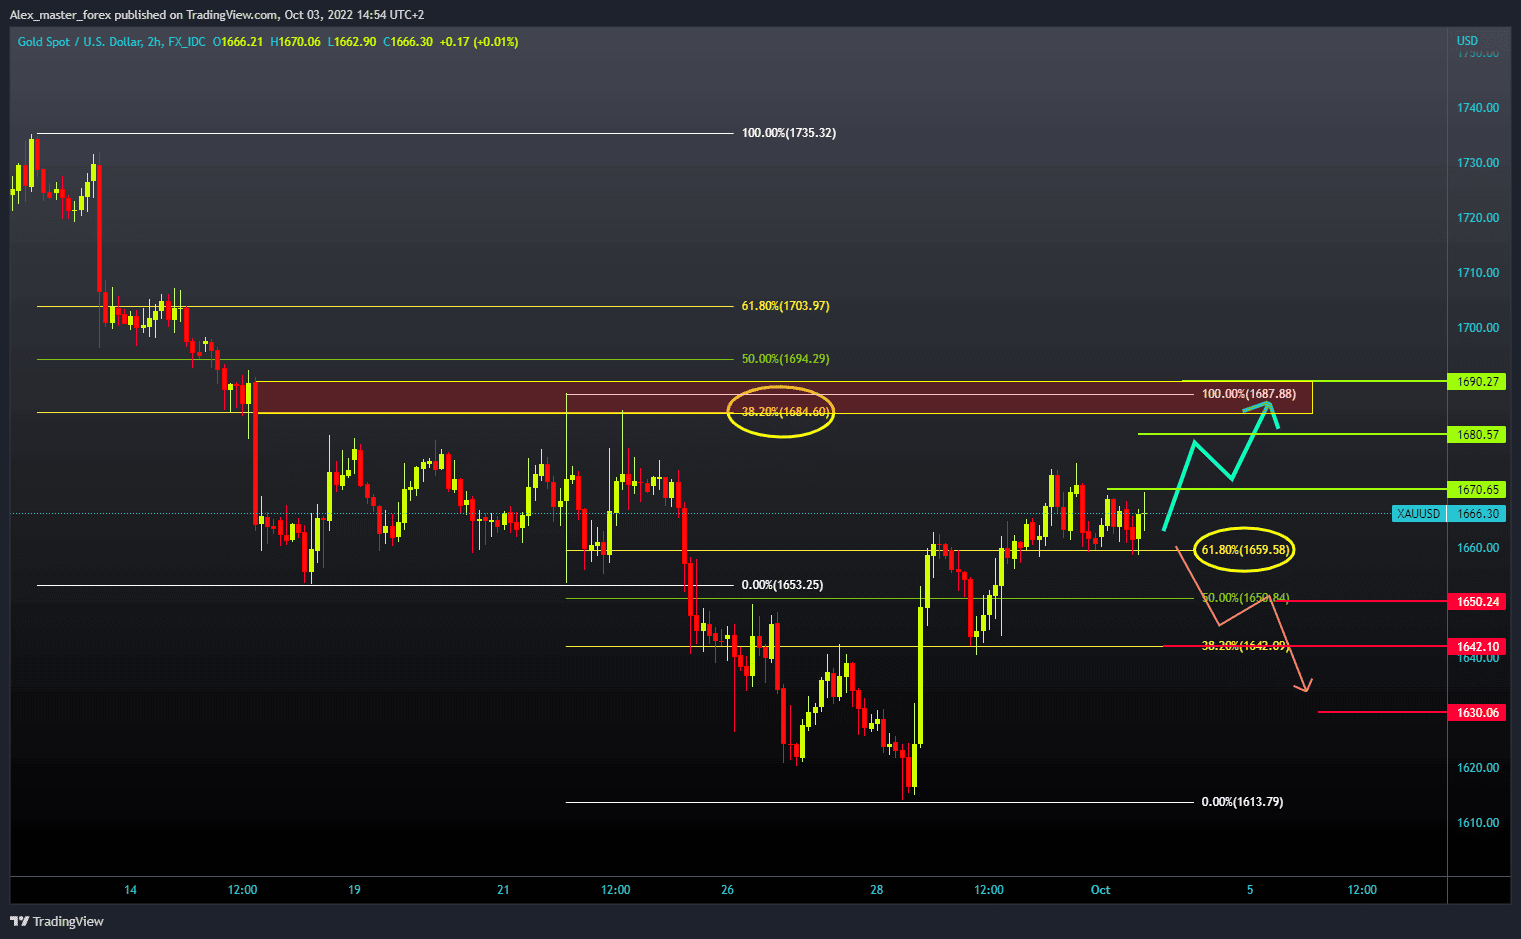
- The price of gold continues with positive consolidation above the $1660 level.
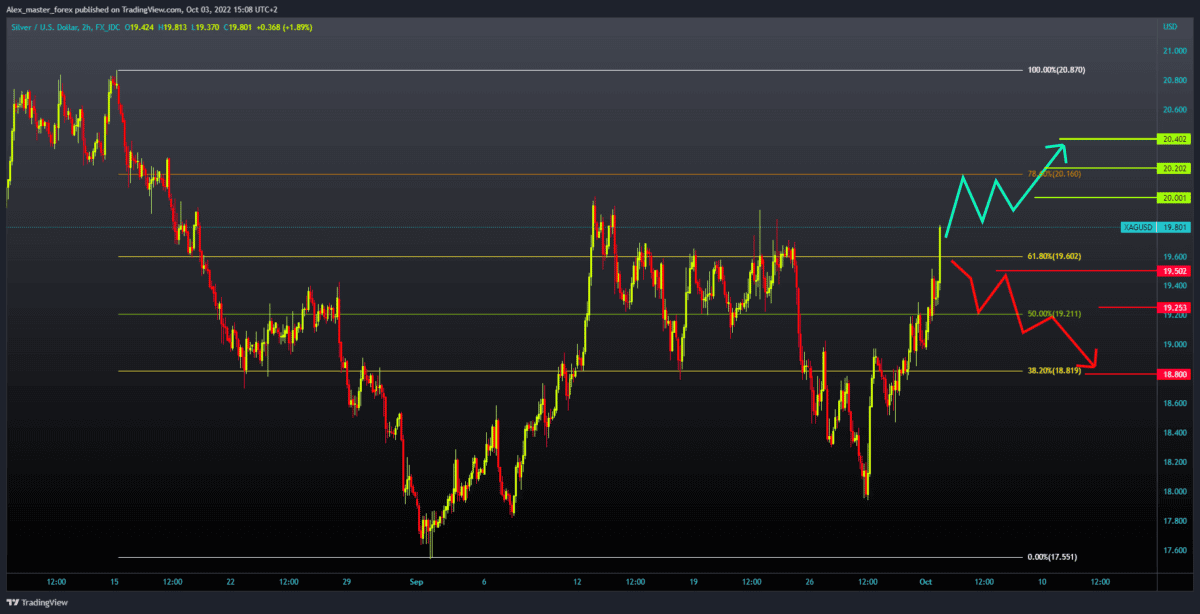
- The price of silver managed to break the $19.70 previous high on September 23, stopping at the $19.75 level.
Gold chart analysis
The price of gold continues with positive consolidation above the $1660 level. We are now looking to see if the price of gold will manage to climb above Friday’s previous high of $1675. We are generally very close to that level, and a bullish impulse would end it. After that, we could expect the price to continue growing, and the potential following targets are $1680 and $1690. We need a price drop below the $1660 level for a bearish option. After that, gold could go down to 38.2% Fibonacci to $1640 and test the previous low there, and potential support. If we fail in this, the price will continue to slide, and our target is last week’s low at $1614.
Silver chart analysis
The price of silver managed to break the $19.70 previous high on September 23, stopping at the $19.75 level. If the dollar’s weakening continues, the price of silver will very quickly reach the $20.0 level. A potential higher target is now $20.20 at 78.6% Fibonacci. A move above and holding in that zone could spawn a new bullish impulse that would take us to the $21.00 level. For a bearish option, we need a new negative consolidation and price pullback below the 61.8% Fibonacci at $19.60. Further price decline could be stopped at 50.0% Fibonacci at the $19.20 support level. Potential lower targets are $19.00 and $18.80 at 38.2% Fibonacci.
BONUS VIDEO: Weekly news summary from the markets
Get the latest economy news, trading news, and Forex news on Finance Brokerage. Check out our comprehensive trading education and list of best Forex brokers list here. If you are interested in following the latest news on the topic, please follow Finance Brokerage on Google News.