

- The price of Bitcoin has been in the range of $19,600-$20,000 today.
- The price of Ethereum still fails to climb above the $1500 level but is leaning towards the 14504 support level.
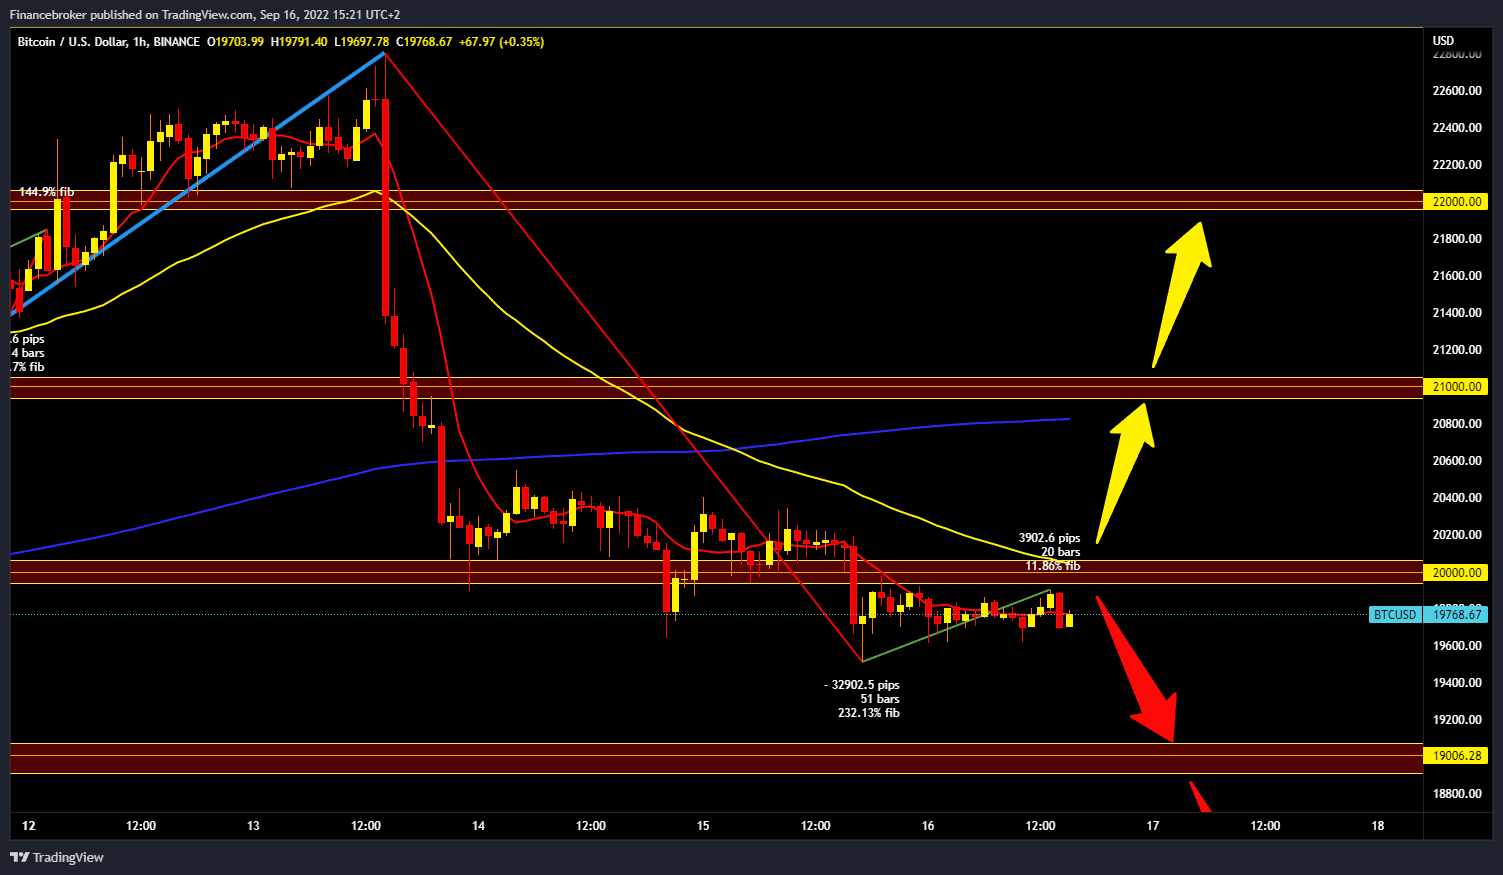
Bitcoin chart analysis
The price of Bitcoin has been in the range of $19,600-$20,000 today. No more pop-ups from this channel. Bearish pressure is still present after the price dropped drastically from the $22,800 level on September 13. To continue the bearish option, we need a break below this consolidation. And our potential lower support zone is at the $19,000 level. We need a positive consolidation and a return above the $20000 level for a bullish option. If we could do that, we would get additional support in the MA50 moving average. Potential higher targets are $20500 and $21000 levels.
Ethereum chart analysis
The price of Ethereum still fails to climb above the $1500 level but is leaning towards the 14504 support level. Ethereum could easily slip to the $1400 level and look for new support there. We need a positive consolidation to go back above the $1500 level for a bullish option. Then we must hold above and try with a new impulse to continue the bullish recovery. Potential higher targets are $1550 and $1600 levels. In the zone around $1530, we have additional resistance in the MA50 moving average, while the MA200 is higher at the $1660 level.

BONUS VIDEO: Weekly news summary from the markets
-
Support
-
Platform
-
Spread
-
Trading Instrument
Get the latest economy news, trading news, and Forex news on Finance Brokerage. Check out our comprehensive trading education and list of best Forex brokers list here. If you are interested in following the latest news on the topic, please follow Finance Brokerage on Google News.