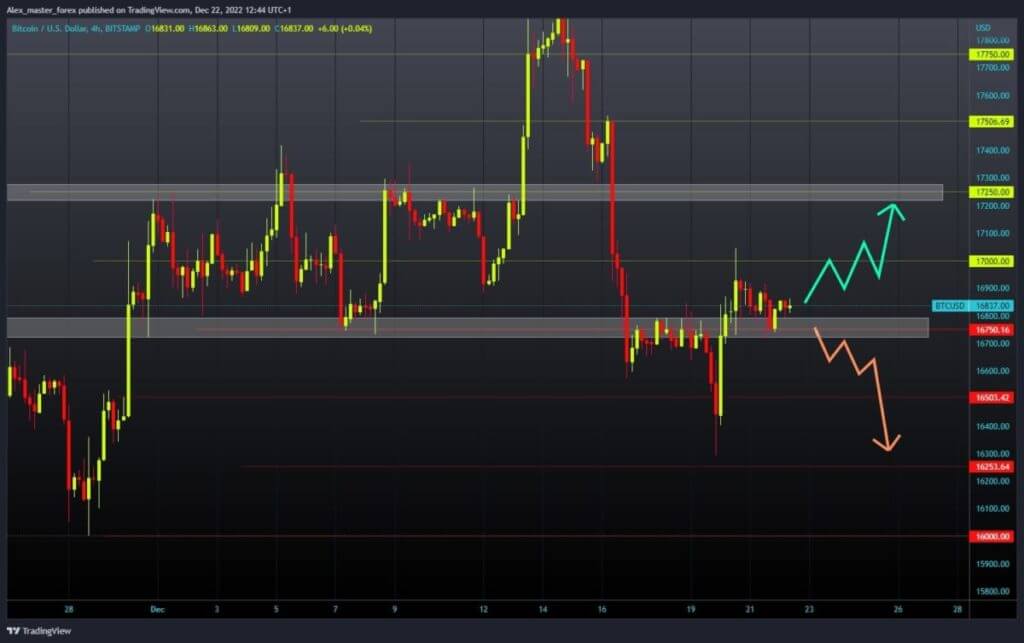
- Bitcoin continues to consolidate around the $16750 level.
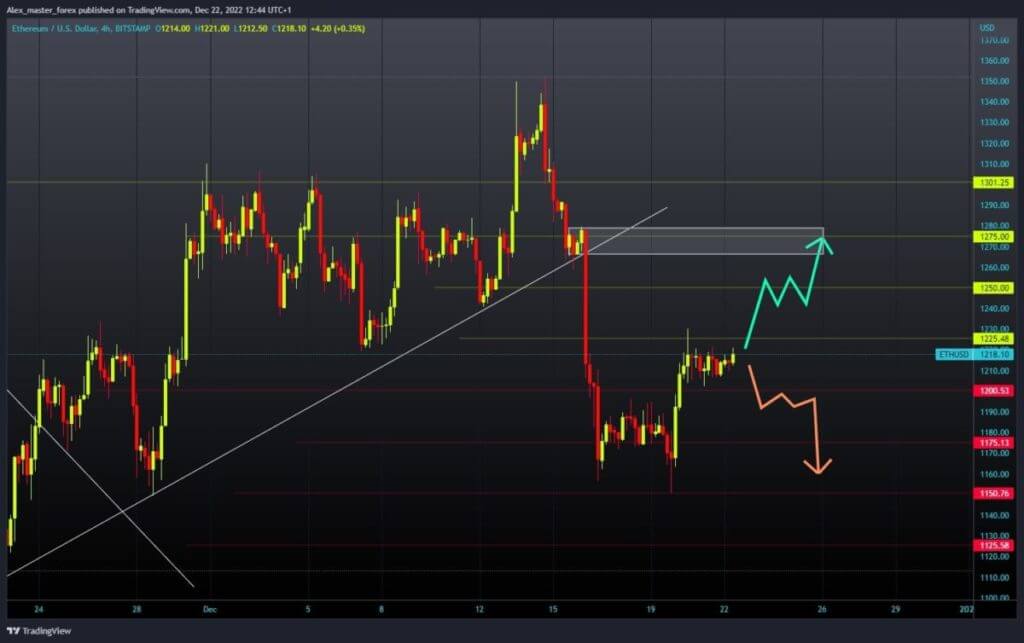
- The Ethereum chart picture is more concrete than the Bitcoin chart as we see bullish consolidation.
Bitcoin chart analysis
Bitcoin continues to consolidate around the $16750 level. Bitcoin price movement is calm for now, and there are no big oscillations. We need a break above the $17000 level to initiate a bullish recovery. Then the bitcoin must move above that level, and thus we would form a new support zone. After that, we could expect to continue the recovery with the next bullish impulse.
A potential higher target is the $17250 level. We need a break below the $16750 support level for a bearish option. Then we could expect to see the price drop to the next support at the $16500 level. Potential and lower targets are $16250 and $16000 levels.

Ethereum chart analysis
The Ethereum chart picture is more concrete than the Bitcoin chart as we see bullish consolidation. The price is moving upward slowly, and a new breakout above the $1225 level could occur. Then it would be beneficial for the price to stay up there and consolidate before starting a further recovery with a new impulse. Potential higher targets are the $1250 and $1275 levels.
We need a negative consolidation and pullback below the $1200 support level for a bearish option. After that, we would fall into the previous movement zone with support at the $1175 level. If price pressure continues, a breakout below is the expected sequence of events. Potential lower targets are $1150 and $1125 levels.

BONUS VIDEO: Weekly news summary from the markets

