
[ad_1]
Vital Statistics:
| Last | Change | |
| S&P futures | 4,003 | -0.25 |
| Oil (WTI) | 76.42 | -0.43 |
| 10 year government bond yield | 3.57% | |
| 30 year fixed rate mortgage | 6.37% |
Stocks are flattish this morning on no real news. Bonds and MBS are flat as well.
Home prices fell 2.4% QOQ in November, according to the Clear Capital Home Data Index. It is interesting to see places like the Midwest and Northeast lead while the hottest markets on the West Coast are taking a beating. Take a look at some of the declines below:
You might see YOY declines in places like San Francisco soon. Affordability constraints actually do matter at some point.
Falling home prices have exhumed a demon from the past – negative equity. According to Black Knight, 8% of mortgaged home purchases from 2022 are now underwater. Overall negative equity numbers remain low, however.
Among FHA mortgages originated this year, over 25% are underwater, and 75% have less than 10% equity. According to Black Knight, we are seeing an increase in FHA early payment defaults. A combination of falling home prices and a possible 2023 recession will make servicing GNMA loans a nightmare.
Given affordability problems, home prices should be falling pretty dramatically, but they haven’t at least so far. Blame low inventory for that.
“We’ve now seen four consecutive months of home price pullbacks at the national level,” said Graboske. “But after a couple of significant drops earlier in the summer, the pace of cooling has slowed considerably, with October’s non-seasonally adjusted drop of just 0.43% the smallest decline yet. Though seemingly counterintuitive, the much higher rate environment may be limiting the pace of price corrections due to its dampening effect on inventory inflow and subsequent gridlock in home sale activity. While the median home price is now 3.2% off its June peak – down 1.5% on a seasonally adjusted basis – in a world of interest rates 6.5% and higher, affordability remains perilously close to a 35-year low. Add in the effects of typical seasonality and one might expect a far steeper correction in prices than we have endured so far, but the never-ending inventory shortage has served to counterbalance these other factors. Indeed, the volume of new for-sale listings in October was 19% below the 2017-2019 pre-pandemic average. This marks the largest deficit in six years outside of March and April 2020 when much of the country was in lockdown – with the overall market still more than half a million listings short of what we’d consider ‘normal’ by historical measures.
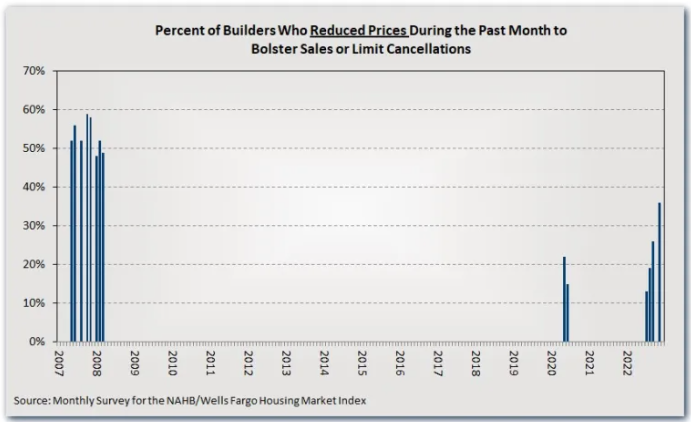
Falling home prices are affecting builders as well. In November, 36% of builders cut prices to move inventory, and 56% were offering some sort of incentive.

We are also seeing other promotional activity, including offers to pay closing costs, rate buydowns, or free upgrades.
A Reuters poll shows analysts expect home prices to fall about 12% peak-to-trough. Prices peaked in June, and have already fallen about 4% so far this year. The MSAs that had the fastest growth will probably experience the biggest declines, as we are seeing in the Clear Capital data above.
[ad_2]
Image and article originally from thedailytearsheet.com. Read the original article here.