

- The price of gold has been in a bullish trend for three days now.
- During the Asian trading session, the price of silver rose to $23.30.
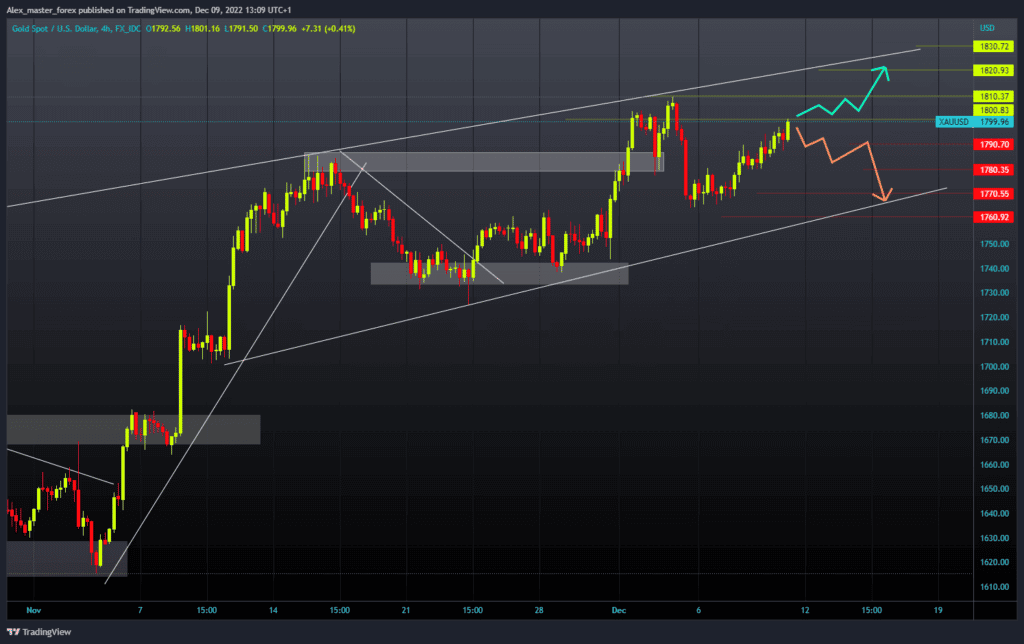
Gold chart analysis
The price of gold has been in a bullish trend for three days now. We are testing the $1800 level again, and a break above could easily occur. The potential next resistance for us is $1810, our December high. If the price of gold continues its current movement, it could also be found above this level. Thus, we would form a new higher high. Potential higher targets are the $1820 and $1830 levels.
For a bearish option, we need a negative consolidation and a pullback of the gold price below the $1790 level. This would take us away from $1800, which could mean that we could see a continuation of the price decline. Potential low targets are $1780 and $1770 levels.
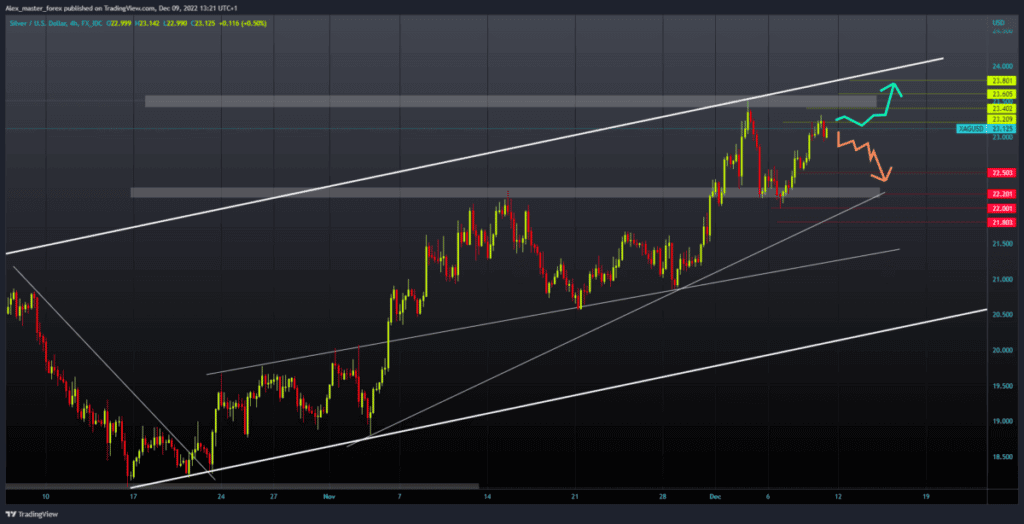
Silver chart analysis
During the Asian trading session, the price of silver rose to $23.30. We then see a minor pullback to $23.00, where we have support for now and manage to hold above. This could trigger a new bullish impulse leading to a move above this morning’s high. That would put us in the zone of the December high at the $23.50 level. And our potential higher targets are the $23.60 and $23.80 levels.
We need a negative consolidation and price pullback to the previous low at the $22.50 level for a bearish option. If by any chance we do not find that support either, the price of silver will slide to lower levels. Potential lower targets are the $22.20 and $22.00 levels.
BONUS VIDEO: Weekly news summary from the markets