[ad_1]
- The oil price tried to break away from yesterday’s $93.00 support zone.
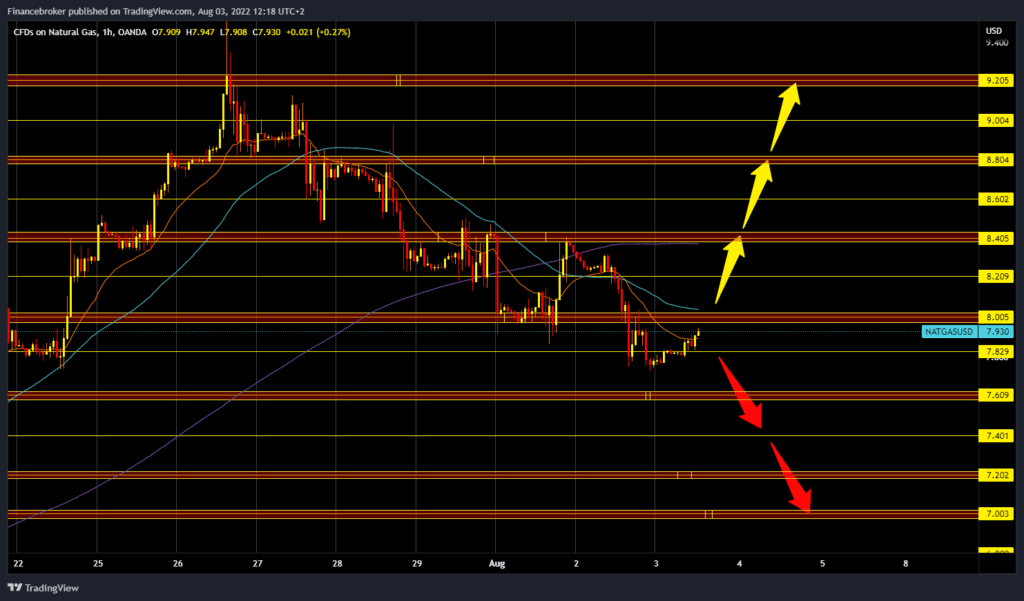
- The price of natural gas continued its one-week bearish trend yesterday, falling below the $8.00 level.
- The American Petroleum Institute (API) reported an unexpected increase for crude oil this week of 2.165 million barrels, while analysts had predicted a draw of 467,000 barrels.
Oil chart analysis
The oil price tried to break away from yesterday’s $93.00 support zone. The price managed to do this but in the short term as it stopped at $96.50 and immediately followed a return to the support zone at $93.00. We have pressure again, which could take us to $92.00 first. For a bearish option, we need a continuation of the negative consolidation and a drop below $92.00. After that, we could expect the price of oil to continue up to $90.00. For a bullish option, we need a new positive consolidation and a return above the $95.00 level. Then we need to hold above that level so that we can consolidate for the next bullish impulse. Potential higher targets are $96.00, $97.00 and $98.00 levels.
Natural gas chart analysis
The price of natural gas continued its one-week bearish trend yesterday, falling below the $8.00 level. During the Asian trading session, the price stabilized and regained part of the losses, rising to $7.95, while yesterday’s low was at the $7.72 level. For a bullish option, we need a continuation of today’s positive consolidation and a return above the $8.00 level. If we could do that, we would get additional support in the MA20 and MA50 moving averages. Potential higher targets are $8.20 and $8.40, the previous high. For the bearish option, we need negative consolidation and pullback to the $7.60 level. With that, we would form a new lower low, which is a sign that the price is still in a downward trend. Potential lower targets are $7.40, $7.20 and $7.00 levels.

Market overview
API reports
The American Petroleum Institute (API) reported an unexpected increase for crude oil this week of 2.165 million barrels, while analysts had predicted a draw of 467,000 barrels. The build comes as the Energy Department released 4.6 million barrels from the strategic oil reserve in the week ending July 29, to 469.9 million barrels. U.S. crude oil inventories have fallen by about 63 million barrels since the start of 2021.
WTI rose on Tuesday as OPEC+ revised its estimate of a global crude oil surplus for this year. For the week ending July 22, data on US crude oil production rose by 200,000 barrels per day to 12.1 million barrels per day, according to the latest data from the EIA.
BONUS VIDEO: Weekly news summary from the markets
-
Support
-
Platform
-
Spread
-
Trading Instrument
Get the latest economy news, trading news, and Forex news on Finance Brokerage. Check out our comprehensive trading education and list of best Forex brokers list here. If you are interested in following the latest news on the topic, please follow Finance Brokerage on Google News.
[ad_2]
Image and article originally from www.financebrokerage.com. Read the original article here.

