[ad_1]
- On Friday, the price of oil failed to break through the $95.00 level, and a new price pullback followed.
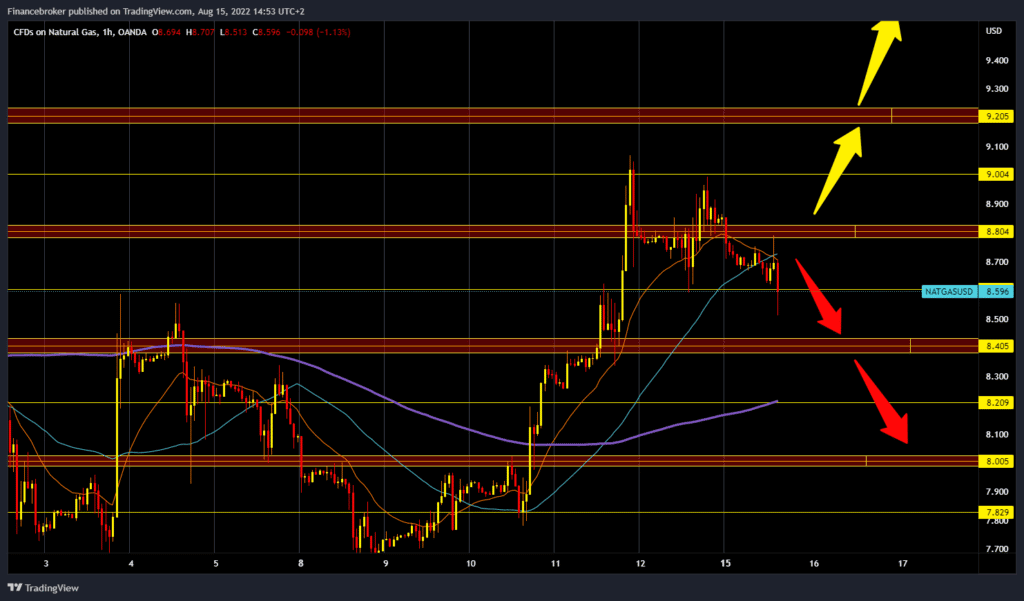
- During the Asian trading session, the price of natural gas retreated from the $8.80 level.
- Yesterday, the CEO of Saudi Aramco said that if the government asks, they will be able to increase production to a capacity of 12 million barrels per day.
Oil chart analysis
On Friday, the price of oil failed to break through the $95.00 level, and a new price pullback followed. By the end of the trading day on Friday, the oil price had fallen to the $92.00 level. During the Asian trading session, the price continued the bearish trend, dropped below $90.00, and stopped at $87.40. The oil price is now trying to find support in the zone around the $88.00 level. From August 4 to 8, we were already in that zone from which the price of oil managed to recover in the short term to the $95.00 level. We need to consolidate above the $88.00 level for a bullish option. After that, a bullish impulse is needed to start a new price recovery. Potential higher targets are $90.00 and $92.00 levels. We need a continuation of today’s negative consolidation for a bearish option. Potential lower targets are $97.00 and $86.00 levels.
Natural gas chart analysis
During the Asian trading session, the price of natural gas retreated from the $8.80 level. The price has already fallen below $8.60 and continues towards $8.40, the next support zone. At the end of last week, we failed to break above the $9.00 level and have been in a pullback ever since. The Ma20 and MA50 moving averages are now slowly moving to the bearish side, which could increase the bearish pressure. We need a price drop below the $8.40 level to continue the bearish trend. After that, we could continue towards the $8.20 level, where the MA200 moving average is waiting for us, which could possibly stop this decline. Potential lower targets are $8.20 and $8.00 levels. For a bullish option, we need a new positive consolidation and a return of the gas price above the $8.80 level. If we managed to stay above, we would have a new chance to test the $9.00 level. A potential higher target is the $9.20 level.

Market Overview
A slowdown in China’s economy is reducing demand for crude oil, and disappointing retail sales and industrial production data from China fueled concerns about a potential global recession. Yesterday, the CEO of Saudi Aramco said that if the government asks, they will be able to increase production to a capacity of 12 million barrels per day.
BONUS VIDEO: Weekly news summary from the markets
-
Support
-
Platform
-
Spread
-
Trading Instrument
Get the latest economy news, trading news, and Forex news on Finance Brokerage. Check out our comprehensive trading education and list of best Forex brokers list here. If you are interested in following the latest news on the topic, please follow Finance Brokerage on Google News.
[ad_2]
Image and article originally from www.financebrokerage.com. Read the original article here.

